Method
The trials investigated in this study have been registered in the German clinical trials register (DRKS00004709, DRKS00005973, DRKS00005025). We present the methods and results of this secondary analysis in accordance to the CONSORT Statement (Moher et al., 2010), and the Guidelines for Executing and Reporting Research on Internet Interventions (Proudfoot et al., 2011). The Preferred Reporting Items for Systematic Reviews and Meta-Analyses (PRISMA; Moher et al., 2009) are followed only were applicable, since data used in this study is not based on a comprehensive literature search. The material used for the analyses in this study has been made openly available in an Open Science Framework (OSF) repository.
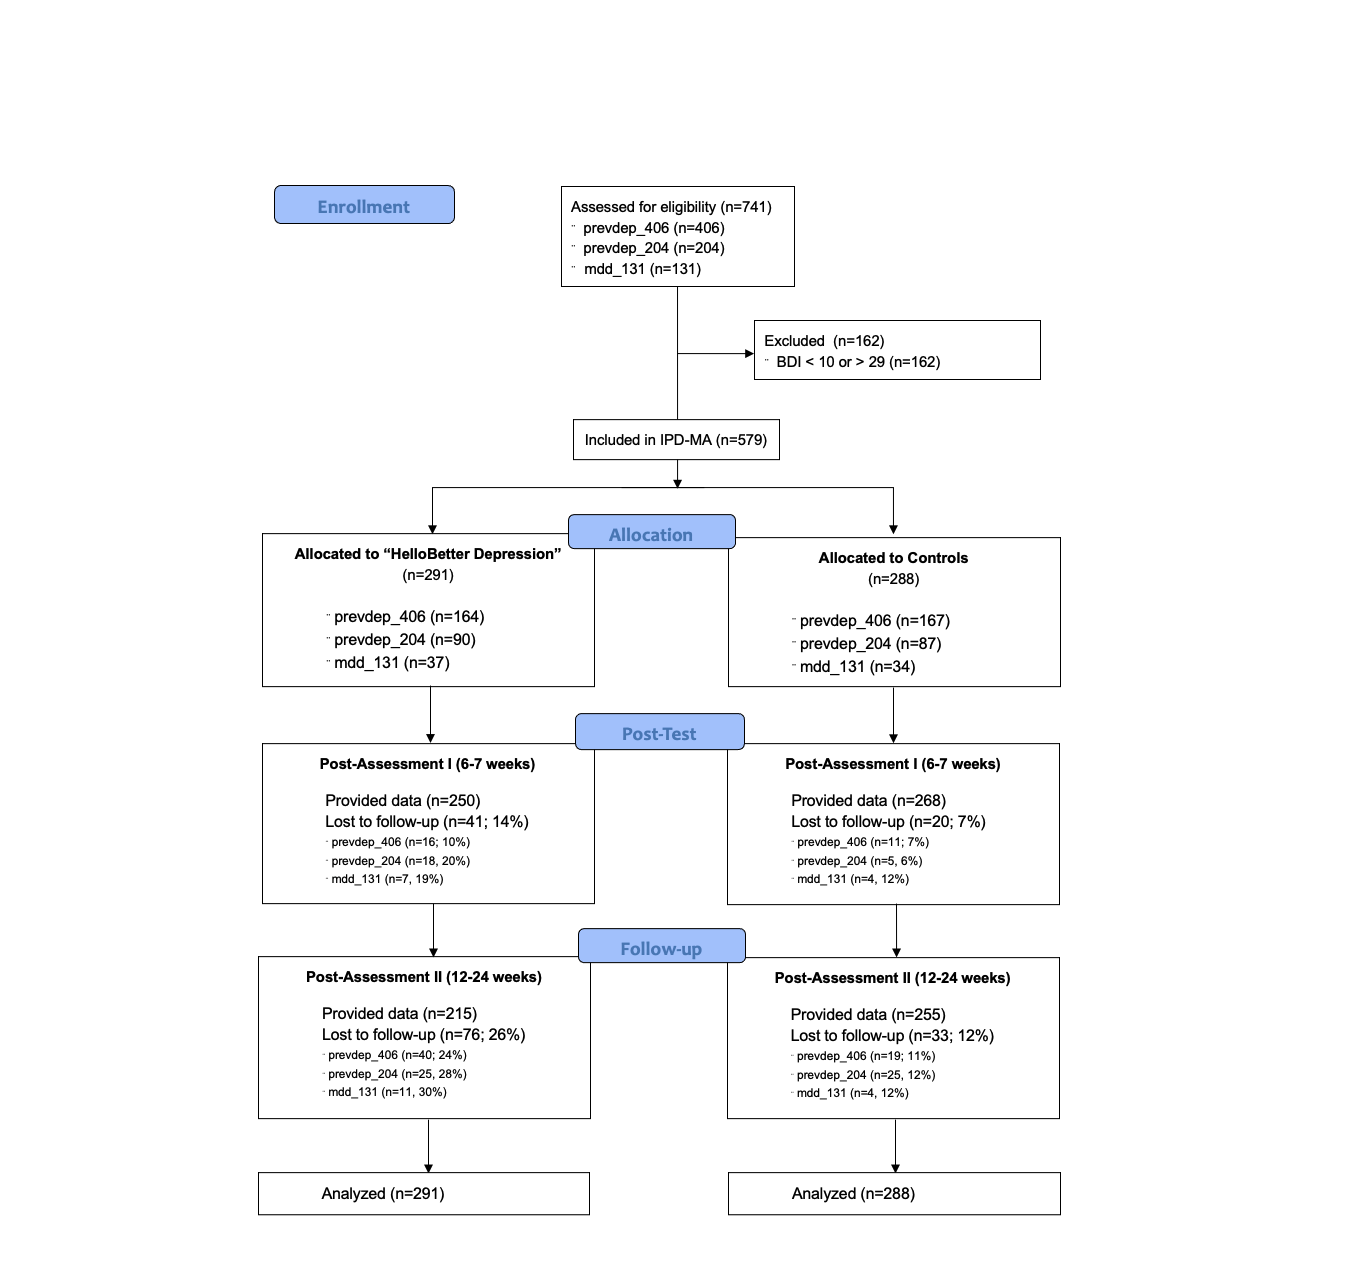
A total of \(k=3\) primary studies were included in this IPD meta-analysis. These trials will be referenced as prevdep_406, prevdep_204 and mdd_131 throughout the report. Included studies are previously conducted randomized controlled trials evaluating the intervention “HelloBetter Depression” (research title: “Get.On Mood Enhancer”). Detailed reports of these primary studies have been published elsewhere in peer-reviewed publications (prevdep_406: Buntrock et al., 2015; prevdep_204: Ebert et al., 2018; mdd_131: Reins et al., 2019).
Design
The included studies are two-armed randomized controlled trials. The intervention groups (IG; prevdep_406: \(n\)=164; prevdep_204: \(n\)=90; mdd_131: \(n\) = 37; \(n_{total}\) = 291) received “HelloBetter Depression”, and Internet- and mobile-based depression intervention. Control groups (CG; prevdep_406: \(n\)=167; prevdep_204: \(n\)=87; mdd_131: \(n\) = 34; \(n_{total}\) = 288) received brief psychoeducation for depressive symptoms. Assuming a fixed-effect inverse-variance pooling model, this sample size allows for detecting an effect of \(SMD = 0.24\) while maintaining a sufficient power of \(1-\beta = 0.8\) (Harrer et al., 2019).
Participants in all primary studies were assessed at baseline (T0), post-treatment (T1; 6-7 weeks after baseline), and follow-up (T2; prevdep_406 and prevdep_204: 24 weeks; mdd_131: 12 weeks after baseline).
Participants
Primary study prevdep_406 originally included \(N\)=406 participants from the general population recruited via a large statutory health insurance company. Included participants were adults with subthreshold depression (ICD-10 equivalent F32.0; Centre for Epidemiological Studies’ Depression Scale score ≥ 16, no current Major Depression according to Diagnostic and Statistical Manual of Mental Disorders criteria).
Study prevdep_204 originally included \(N\)=204 participants recruited in the general population via a large health insurance. For inclusion, participants had to suffer from subthreshold depression (ICD-10 equivalent F32.0; Centre for Epidemiological Studies’ Depression Scale score ≥ 16, no current Major Depression according to Diagnostic and Statistical Manual of Mental Disorders criteria) at baseline.
Study mdd_131 originally included \(N\)=131 participants, which were also recruited from the general population through a large health insurance. To be eligible for inclusion, participants had to suffer from major depression (ICD-10 equivalent F32.1 and F32.2; current Major Depression according to Diagnostic and Statistical Manual of Mental Disorders criteria) at baseline.
Further eligibility criteria applied in all included primary studies were (i) being at least 18 years old, (ii) having Internet access, (iii) declaring willingness to provide self-report data at all three assessment points, and (iv) provision of informed consent.
To eligible for the present meta-analysis, participants had to experience mild to moderate symptoms of depression at baseline, as indicated by scores of 10-29 at baseline on the Beck Depression Inventory (BDI-I; Beck et al., 1961). These cut-off scores are based on the German S3 Leitlinie Unipolare Depression consensus statement (p. 177). This range of scores primarily covers symptom severities representative of ICD codes F32.0 and F32.1. Participants included in the primary studies with values outside the BDI-I 20-29 range were excluded from the meta-analysis.
Randomization
Randomization in all primary studies was conducted using an automated computer-based random integer generator (Randlist, Datinf GmbH, Tübingen, Germany). Randomization was conducted by a researcher who was not otherwise involved in the study. During the randomization procedure, allocation was concealed from participants, recruitment staff, diagnosticians, and e-coaches.
Intervention
All three studies evaluated “HelloBetter Depression” (Ebert et al., 2014); a guided self-help iCBT intervention consisting of six interactive sessions. Each session lasts about 45-60 minutes, though the duration might vary between users. The program was also available beyond the post assessment at 6-7 weeks. The modules rely on evidence-based face-to-face manuals that have been shown to be effective at reducing depressive symptomatology, including psychoeducation, and exercises for behavioral activation, problem solving, and relapse prevention. A strong emphasis was placed on homework assignments designed to integrate acquired coping skills into daily life. Participants were supported by eCoaches (psychotherapists-in-training supervised by an experienced clinician). Guidance took place in the form of individualized written feedback after each module. A motivational, adherence-focused feedback concept was employed.
Control Group
Participants in the control condition got access to a web-based psychoeducational intervention and care-as-usual. Psycho-educational interventions have been shown to be effective in reducing depressive symptoms and might serve as initial interventions in primary care (Donker et al., 2009). The psycho-educational intervention was based on the German S3-Guideline/National Disease Management Guideline for Unipolar Depression. It informed participants about the nature and evidence-based treatments of depression, including information about symptoms and sources of help. Offering the web-based psycho-educational intervention mimicked and enhanced usual care as information that patients might not always receive from their GP was systematically offered. Participants could go through the material as often as they wanted to. The psycho-educational intervention did not require participants to do homework assignments and there was no guidance.
Primary Outcome
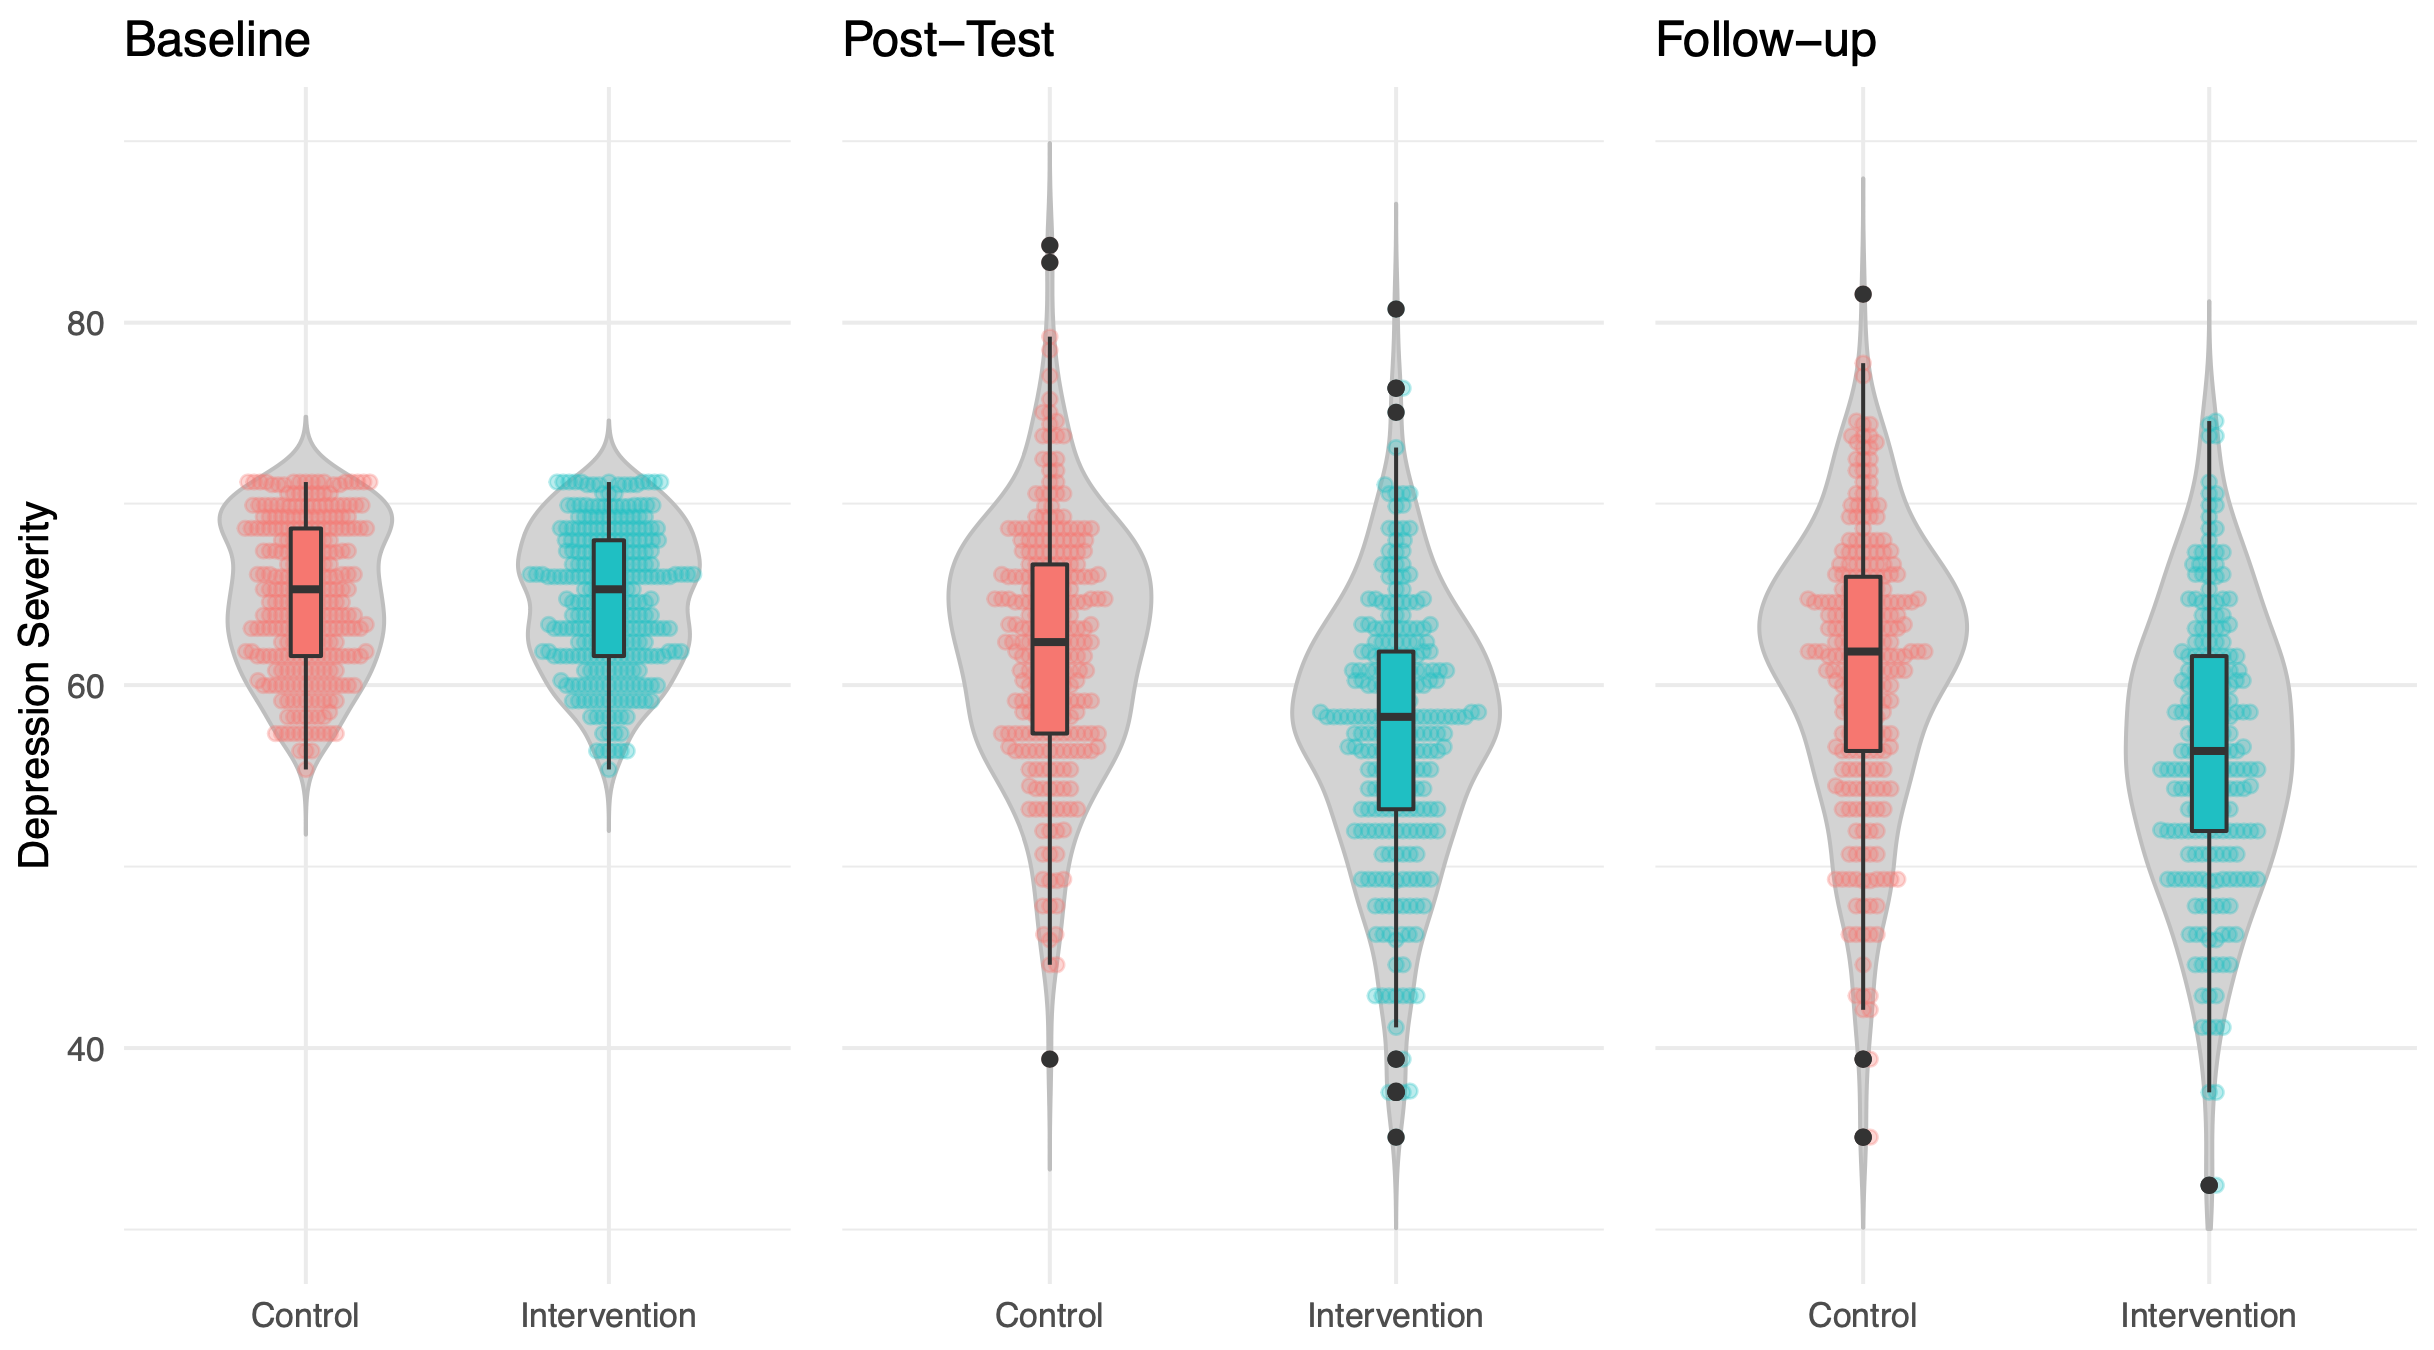
The primary outcome were symptoms of depression at post-test (6-7 weeks after baseline). Instruments to assess depressive symptom severity differed in the primary studies. Studies prevdep_406 and prevdep_204 used the German version of the Center for Epidemiological Studies’ Depression Scale (CES-D) 20-item version (ADS; Hautzinger, Bailer, Hofmeister, & Keller, 2012; 20 items; range 0-60). Study mdd_131 operationalized depressive symptoms through the Patient Health Questionnaire 9 (PHQ-9; 9 items; range 0-27). Depressive symptom scores were therefore transformed to common metrics in order to allow joint analyses. A common metric is an Item Response Theory model, such as the GRM (Graded Response Model) or the GPCM (Generalized Partial Credit Model), that comprises parameters of items from various measures, measuring a common variable. Item parameters describe the relation between item response and latent variable. With such statistical model, one can estimate this common variable by subsets of items, e.g. if different measures are used or if data are missing. We used the common metrics model developed in Wahl et al. (2014). Common metrics were also used to determine BDI-I-based mild to moderate symptom scores, since this measure was not consistently used in the primary studies.
Secondary Outcomes
Secondary outcomes included anxiety as measured by the anxiety sub-scale of the Hospital Anxiety and Depression Scale (HADS-A; Zigmond & Snaith, 1983; 7 items; range 0-21), and behavioral activation as measured by the short form of the Behavioral Activation for Depression Scale (BADS-SF; Fuhr et al. 2016; 9 items; range 0-54). Secondary outcomes were measured at baseline, post-test and follow-up in all included primary studies. Client satisfaction with the intervention was assessed using the Client Satisfaction Questionnaire (adapted to the online context; CSQ-8; Boß et al., 2016; Nguyen, Attkisson, & Stegner, 1983; 8 items; IGs only).
Statistical Analyses
To evaluate the effectiveness of the intervention compared to the CG, analyses based on the intention-to-treat (ITT) principle were conducted. Analyses were conducted with R version 3.5.2 (R Core Team, 2013).
A joint modeling, multilevel-multiple imputation by chained equations (MICE) model was used to impute missing data (Jolani et al., 2015; Schafer & Yucel, 2002). Trial membership was used as a level-2 variable in the imputation model to account for the nested data structure (patients-in-trials). All subsequent analyses were conducted in the \(m\)=50 multiply imputed data sets. Test statistics and parameter estimates were calculated using Rubin’s rule (Barnard & Rubin, 1999).
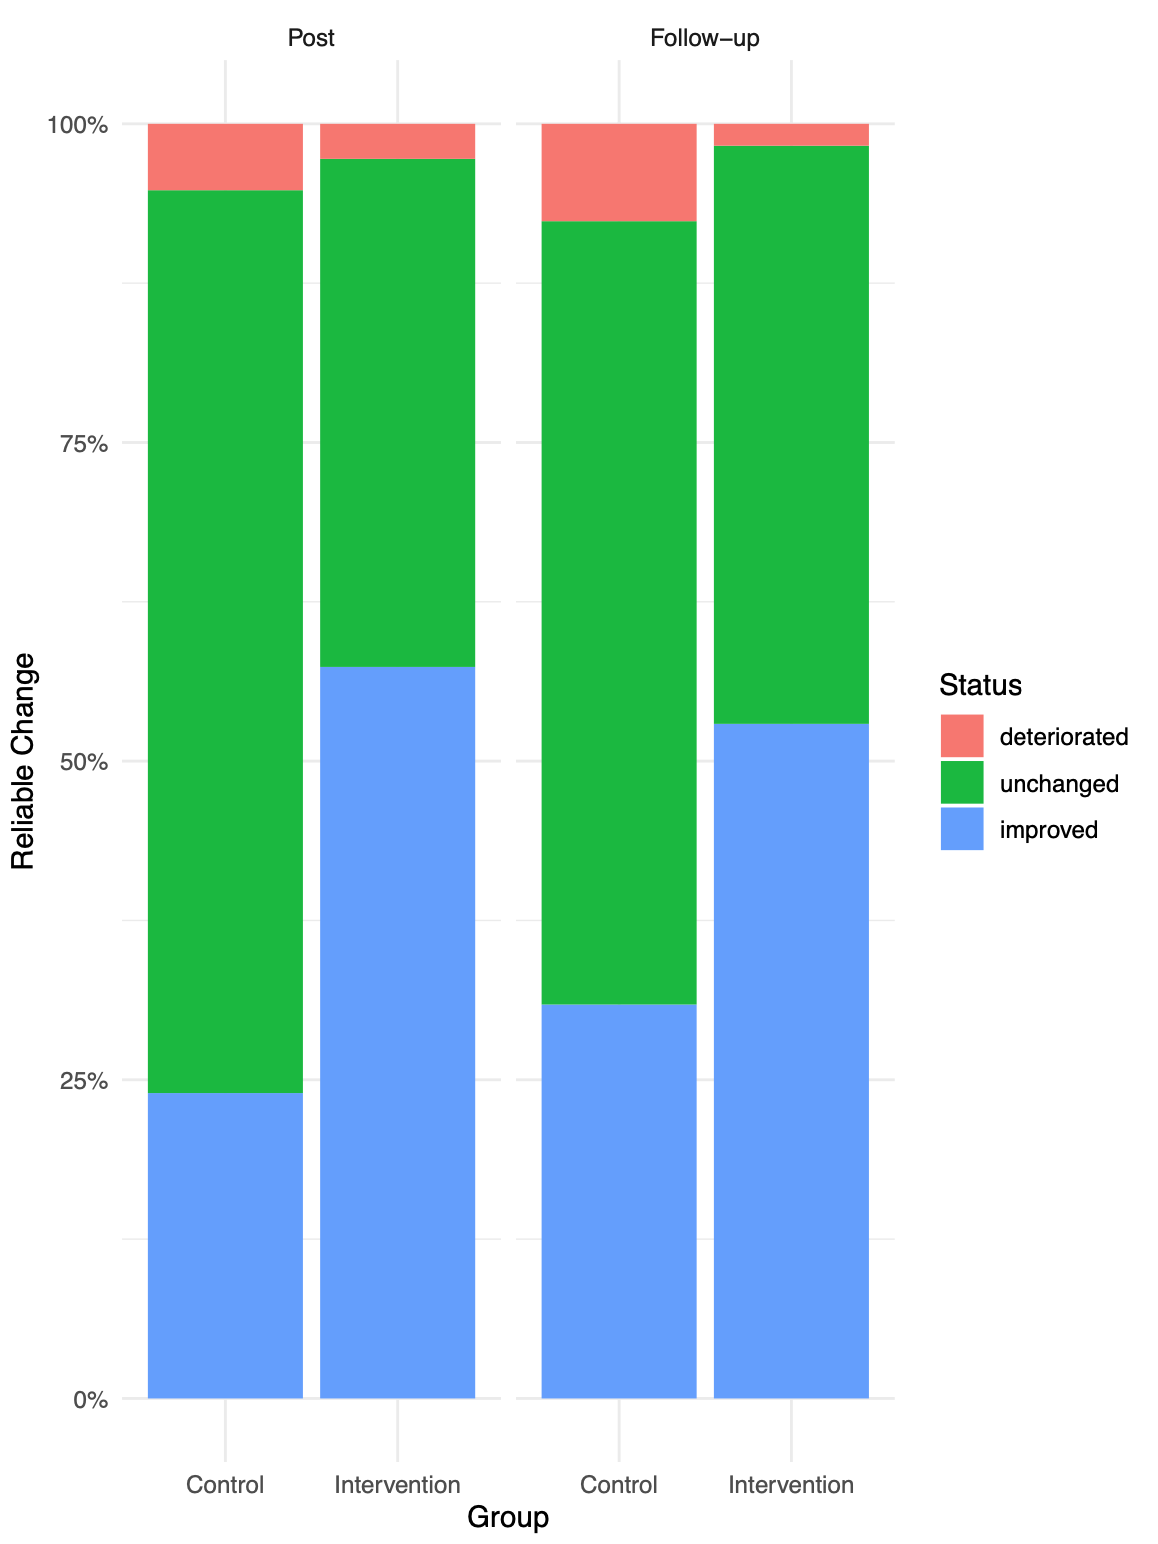
We tested if the intervention was superior the active control in terms of (i) effects on participants’ depressive symptom severity and secondary outcomes from baseline to post-test (T1), and from baseline to three-month follow-up (T2). We also compared the proportion of participants with (ii) reliable response and (iii) reliable symptom deterioration between the IG and CG at T1 and T2. A significance level of 0.05 (two-sided) was used for all analyses.
Differences in effects between the two study conditions across the included primary studies were assessed using one-step IPD meta-analysis methods. We used linear mixed-effects models which included (1) a random study intercept and random group slope, as well as (2) a fixed-effect term controlling for baseline symptom severity to determine the overall intervention effects. To calculate effect sizes on depression (i.e. Cohen’s \(d\)), un-standardized group coefficients estimated in the linear mixed-effects models were divided by 10, exploiting that the common depression metric is standardized to have a population standard deviation of \(\sigma = 10\). The pooled sample standard deviation at the assessed time point was used to standardize effects on secondary outcomes.
To determine if the depressive symptoms of patients had reliably decreased, we coded participants as responders or non-reponders using the Reliable Change Index (RCI; Jacobson & Truax, 1991). We compared the proportions of reliable responders in the IGs and CGs at post-test and follow-up using \(\chi^2\)-tests. Using the RCI, we also determined potential negative effects, defined as cases with a reliable depressive symptom deterioration. Differences in deterioration cases between groups were also compared using \(\chi^2\)-tests.
Lastly, we used descriptive statistics to analyze the intervention satisfaction reported by IG patients.
References
Barnard, J., & Rubin, D. B. (1999). Miscellanea. Small-sample degrees of freedom with multiple imputation. Biometrika, 86(4), 948-955.
Beck, A. T., Ward, C., Mendelson, M., Mock, J., & Erbaugh, J. (1961). Beck Depression Inventory (BDI). Arch Gen Psychiatry, 4(6), 561-571.
Boß, L., Lehr, D., Reis, D., Vis, C., Riper, H., Berking, M., & Ebert, D. D. (2016). Reliability and validity of assessing user satisfaction with web-based health interventions. Journal of Medical Internet Research, 18(8), e234.
Buntrock, C., Ebert, D., Lehr, D., Riper, H., Smit, F., Cuijpers, P., & Berking, M. (2015). Effectiveness of a web-based cognitive behavioural intervention for subthreshold depression: pragmatic randomised controlled trial. Psychotherapy and Psychosomatics, 84(6), 348-358.
Buntrock, C., Ebert, D. D., Lehr, D., Smit, F., Riper, H., Berking, M., & Cuijpers, P. (2016). Effect of a web-based guided self-help intervention for prevention of major depression in adults with subthreshold depression: a randomized clinical trial. JAMA, 315(17), 1854-1863.
Cuijpers, P., Karyotaki, E., Reijnders, M., & Ebert, D. D. (2019). Was Eysenck right after all? A reassessment of the effects of psychotherapy for adult depression. Epidemiology and Psychiatric Sciences, 28(1), 21-30.
Donker T., Griffiths K.M., Cuijpers P., Christensen H. (2009). Psychoeducation for Depression, Anxiety and Psychological Distress: a Meta-Analysis. BMC Medicine, 7(79).
Ebert, D. D., Buntrock, C., Lehr, D., Smit, F., Riper, H., Baumeister, H., … & Berking, M. (2018). Effectiveness of web-and mobile-based treatment of subthreshold depression with adherence-focused guidance: a single-blind randomized controlled trial. Behavior Therapy, 49(1), 71-83.
Ebert, D. D., Lehr, D., Baumeister, H., Boß, L., Riper, H., Cuijpers, P., … & Berking, M. (2014). GET. ON Mood Enhancer: efficacy of Internet-based guided self-help compared to psychoeducation for depression: an investigator-blinded randomised controlled trial. Trials, 15(1), 39.
Fuhr, K., Hautzinger, M., Krisch, K., Berking, M., & Ebert, D. D. (2016). Validation of the Behavioral Activation for Depression Scale (BADS)—Psychometric properties of the long and short form. Comprehensive Psychiatry, 66, 209-218.
Harrer, M., Cuijpers, P., Furukawa, T. & Ebert, D. D. (2019). dmetar: Companion R Package For The Guide ‘Doing Meta-Analysis in R’. R package version 0.0.9000. URL http://dmetar.protectlab.org.
Jolani, S., Debray, T. P., Koffijberg, H., van Buuren, S., & Moons, K. G. (2015). Imputation of systematically missing predictors in an individual participant data meta‐analysis: a generalized approach using MICE. Statistics in medicine, 34(11), 1841-1863.
Kroenke, K., & Spitzer, R. L. (2002). The PHQ-9: a new depression diagnostic and severity measure. Psychiatric Annals, 32(9), 509-515.
Moher, D., Liberati, A., Tetzlaff, J., Altman, D. G., & Prisma Group. (2009). Preferred reporting items for systematic reviews and meta-analyses: the PRISMA statement. PLoS med, 6(7), e1000097.
Reins, J. A., Boß, L., Lehr, D., Berking, M., & Ebert, D. D. (2019). The more I got, the less I need? Efficacy of Internet-based guided self-help compared to online psychoeducation for major depressive disorder. Journal of Affective Disorders, 246, 695-705.
Schafer, J. L., & Yucel, R. M. (2002). Computational strategies for multivariate linear mixed-effects models with missing values. Journal of Computational and Graphical Statistics, 11(2), 437-457.
Wahl, I., Löwe, B., Bjorner, J. B., Fischer, F., Langs, G., Voderholzer, U., … & Rose, M. (2014). Standardization of depression measurement: a common metric was developed for 11 self-report depression measures. Journal of Clinical Epidemiology, 67(1), 73-86.
Zigmond, A. S., & Snaith, R. P. (1983). The hospital anxiety and depression scale. Acta Psychiatrica Scandinavica, 67(6), 361-370.